We obtained a report showing what appears to be a coordinated effort in posting results in the 2020 Election between the states of Pennsylvania and Georgia. The timestamps of updates to the 2020 Election results in these two states are too similar to be a coincidence.
The report below shows a comparison between the Presidential results recorded for Pennsylvania and Georgia in the 2020 Election. Per a review using the Edison data released after the election, the report shows tabulations in the election which are far too consequential.
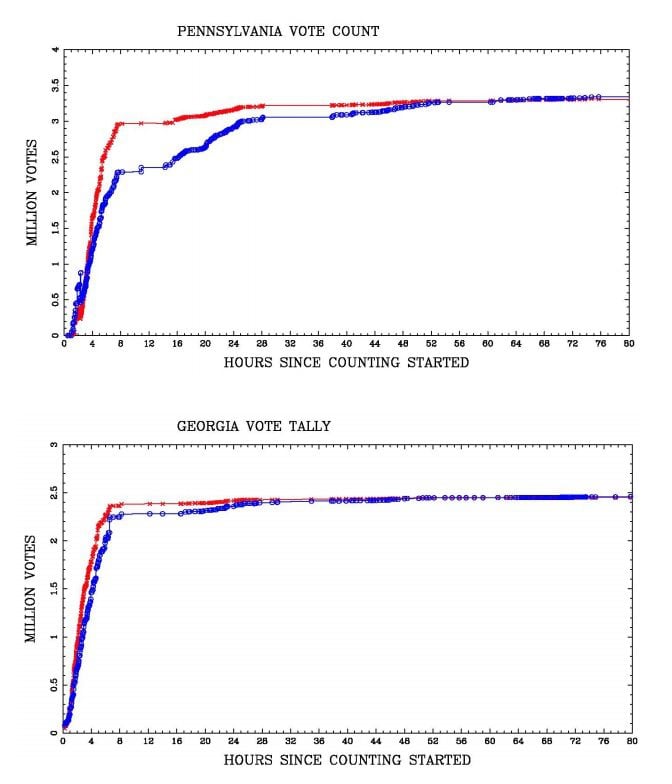
Below is a chart of the results of the Presidential election for each state. The charts are similar and show similar patterns at first glance, especially noting the time from when counting started in the election.

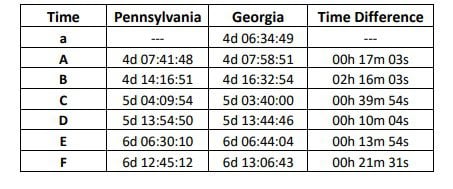
Next, the study identified some key times in the election counting process. These times were recorded by date by hour by minute using the UTC time zone which is the time zone used in the Edison data. (For example, 4d 07:41:48 is November 4th at 7:41:48 in the morning UTC time.) Here were some key times identified in the study:

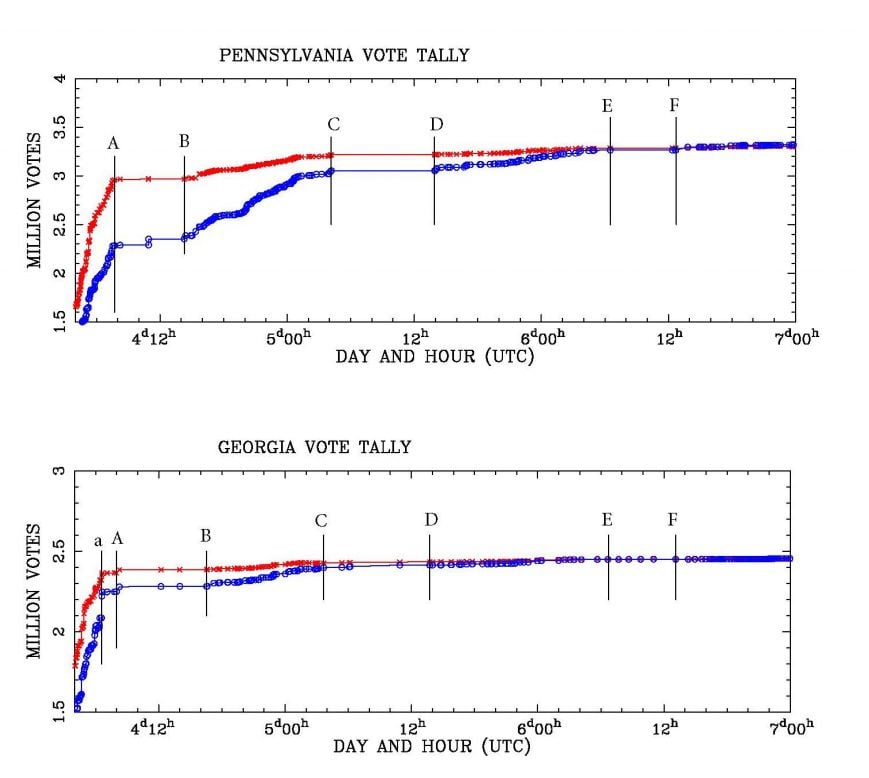
Next, the study shows these same timestamps which are only minutes apart between states in most instances. The chart shows that not much activity was reported in the time periods between timestamps A and B, between C and D, and between E and F which was unique. This indicates that the elections between the states of Pennsylvania and Georgia may have been coordinated.
Also, the pauses that occurred between A and B, C and D, and E and F are to date unexplained. Why was there a pause in reporting during these time periods that occurred at the exact same time? Was there coordination of reporting taking place?
The report notes that the time period needed to count ballots in Ohio, for example, was 6.5 hours for 5.6 million ballots. Why did it take so long for Pennsylvania and Georgia to count their ballots? The study overall shows that there was a coordination in counting procedures between states.

Finally, we also noted that President Trump’s lead was ultimately overturned at the timestamp referred to as F above. At that point, Biden took the lead. In Georgia, another 12,600 ballots were counted after Biden was given the lead (after timestamp F) and nearly every batch of ballots was recorded with the same percent of ballots to Biden and Trump.
In addition, we noted that at timestamp F, in Pennsylvania is when Biden took the lead there. From that point forward all of Pennsylvania’s ballot batches also were recorded at nearly the same ratio giving Biden the majority of the ballots by the same percent (50% for Biden to 49% for President Trump). In Pennsylvania, another 60,600 ballots were counted after timestamp F.
REVIEW OF THE PENNSYLVANIA … by Jim Hoft
The reporting of the ballots counted after timestamp F we referred to months ago as the ‘Roll’ in the ‘Drop and Roll’.
In Summary:
Even though these state election organizations are ostensibly independent, these data show there is a definite coordination of their counting procedures. It implies that some entity had control of
both state voting systems and could possibly manipulate the vote to favor a particular candidate.
Georgia and Pennsylvania should audit their voting systems and all of their ballots to establish that the ballot chain of custody has not been violated and ensure the results include only valid ballots.


No comments:
Post a Comment